新推出的 NVIDIA Nsight 深度學習設計師工具(NVIDIA Nsight Deep Learning Designer)有助於簡化高效能模型設計過程。深度學習設計師對模型結構及它在 NVIDIA 硬體上的效能提供了寶貴的見解。可以透過易用的拖放介面來建立模型,介面中有提供熱門深度學習框架中各項常用的運算節點。
效能分析
打從一開始就必須瞭解模型的效能特徵。設計模型後,可以對其進行效能分析。
選擇 Launch Inference、View、Inference Run Logger,選擇並查看最新的分析報告。
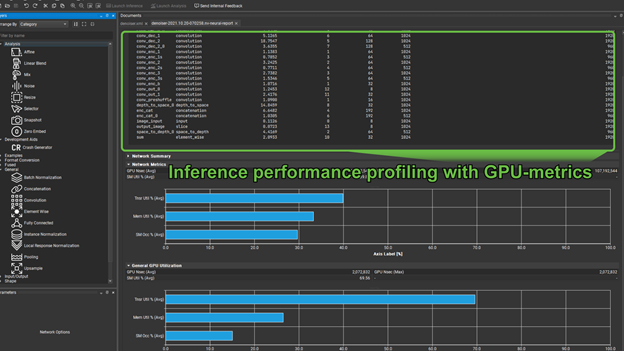
這分為兩大部分。如前所示,第一個部分在表格中列出了運算子、它們的超參數和執行時間。預設會按照最佳化的優先順序來列出(類似於 nvprof 按最佳化的優先順序來列出 kernel 的方式)。
對在 NVIDIA 硬體上運行的任何模型,無論是進行訓練還是推論,一個重要的問題是「這個模型是否使用 Tensor 核心?」分析報告的第二部分顯示了使用 Tensor 核心的情況。
這裡有兩組圖,第一組列出了整個網路的 Tensor 核心利用率、記憶體處理量和 SM 占用率。第二組為從前一個清單中單獨選擇的運算子,提供這些相同的度量。在 Tensor 核心利用率無意義的情況下,例如在運算子池的情況下,Tensor 核心利用率顯示為零。
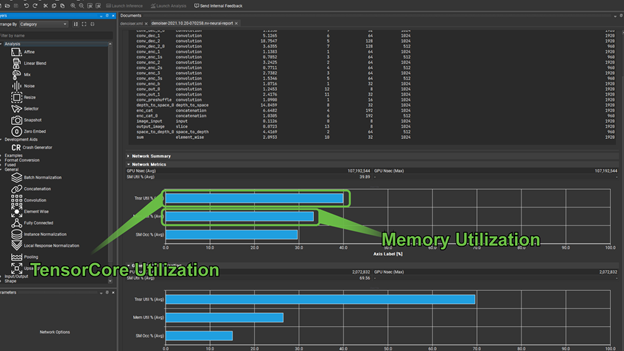
從記憶體利用率可得知是否出現記憶體受限的情況。此時比較謹慎的做法是找機會,在適當的時機融合運算子以使用更快的記憶體。若能有效的使用 GPU 硬體可大幅縮短訓練時間。在訓練大型模型或使用雲端服務時,此舉能顯著降低生產成本。
訓練模型
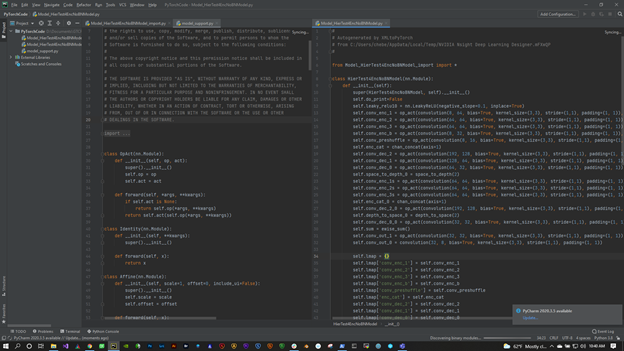
在分析模型以提高效能後,可將模型匯出到 PyTorch 並進行訓練。使用 NHWC 布局且您的 conv2d 卷積神經網路至少有八個輸入/輸出通道的倍數時,改進的部分可納入確保 FP16 。
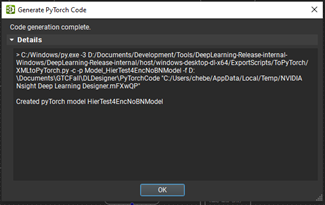
選擇 File、Export、Generate PyTorch Files,以匯出至 PyTorch(圖3)。
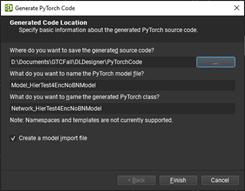
將模型匯出到 PyTorch 時,有提供一些選項來檢查模型名稱及為您選擇的檔案。不過必須為 PyTorch 檔案指定一個輸出目錄,這個目錄裡有一個可訓練模型和一些搭配該模型的實用方法。
如要匯出到 PyTorch,PATH 環境變數和以下模組中必須有 Python 3 環境:
- PyTorch
- Numpy
- Pillow
- Matplotlib
- Fastprogress
成功生成後,關閉 Code generation complete 對話方塊。
分析模型
現在已經可以使用這個程式碼了!下一步就是訓練它,並且把權重載入回深度學習設計師以便分析模型執行任務的情況。
這裡的模型是一個除噪器模型。您可以在範例中自行測試。第一步是將其載入到深度學習設計器中。接著獲取並套用從 PyTorch 中訓練獲得的權重。
選擇 Tools、Network Settings,以配置經過訓練的模型。
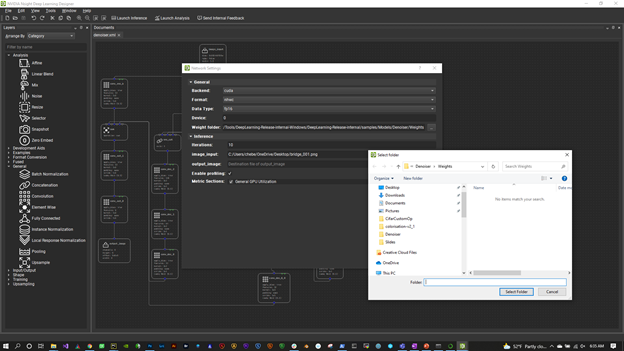
首先要看的是 Weights Folder。選擇輸出訓練權重的目錄。深度學習設計師會選擇這些選項,並將其套用在適當的運算子上。
還有請確保已經設定為 FP16、NHWC 布局和 CUDA 後端。要將快速 Tensor Core 用於卷積神經網路和 GEMM(矩陣乘法)等運算,請使用 FP16。要獲得最快的處理量,請使用 NHWC。
現在可以開始對模型執行視覺化分析。在此之前,請使用部分深度學習設計師分析功能,向經過訓練的模型加入一些節點,以幫助評估其作為除噪器的效能。
分析層
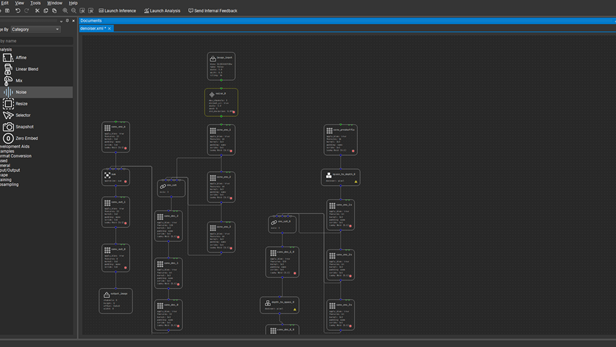
從擴大 Layers 選項板的 Analysis 部分開始。第一個要新增的層是 Noise 層。這個層有助於向輸入影像中注入一些雜訊,以便評估在無雜訊的情況下除噪器重建影像的效果。如要執行此操作,請首先選擇並刪除 Input_image 之間的連接,還有它所連接的三個節點:conv_enc_b、conv_enc_1 及 conv_preshuffle。
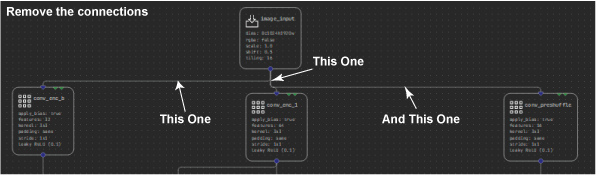
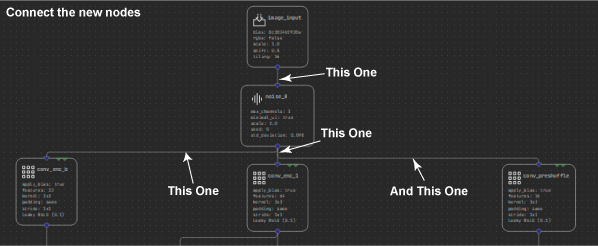
現在選擇影像輸入節點,並將其向上移動一點以便將 Noise 層放在中間。最後,連接 input _image 節點到新的 Noise 層,然後將新的層連接到先前從影像輸入連接的三個節點。運行這個模型時,可以控制要加入影像中的噪點量。
進行分析前或許您會發現還有一個有用的節點,即 Mix 節點。您可以用這個節點,在加入雜訊前將最終除噪輸出內容與原始輸入進行比較。如您所見,可用多種比較方式來瞭解模型的效能。
刪除 conv_out_0 與 output_image 之間的連接,然後在這兩個節點之間插入 Mix 節點,很像以替換連接對噪點節點所做的動作。我建議這裡要小心一點,Mix 節點其實有兩個輸入。
您已經指定了 conv_out_0 做為一個輸入。現在在加入噪點之前,加入其他輸入以連接到模型頂部的原始影像層輸出。
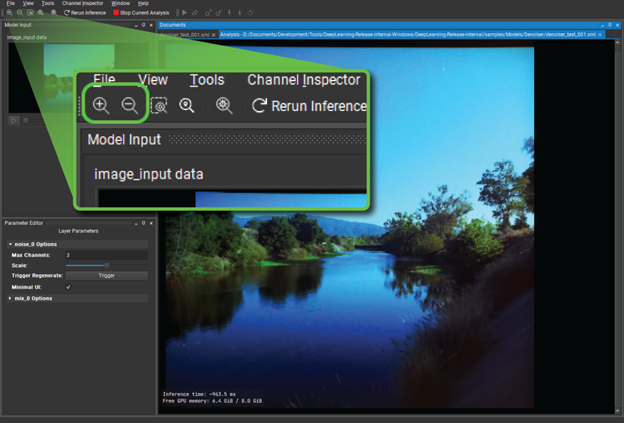
到目前為止,您已經加入了實用的程式來協助分析模型。此時將模型另存為 denoiser_analyze.xml(或類似的名稱),然後選擇 Launch Analysis 查看模型的運行情況。以下簡單拆解了使用者介面:
- image_input_data – 按下滑鼠右鍵,選擇 Open Image Input,瀏覽當成原始輸入的 JPG 或 PNG 檔案。選擇 Ok,模型開始生效,模型的輸出內容顯示在中央面板中。
- Noise 與 Mix – 剛才新增之兩個分析層的選項。
- Network overview – 由模型推論執行的節點圖。
自訂設計檢查
如要繼續,請按兩下 Noise 層,這是 Network Overview 下面的第二層。通過這個標籤底下的 Channel Inspector,可看到推論期間生成的 tensor 的各個通道,即隱藏層。使用在視圖中的 Noise 層通道,現在可返回螢幕右下角的 Noise 層選項。將 Scale 滑桿向右滑動一點,查看影像輸入增加上顯示的雜訊量。
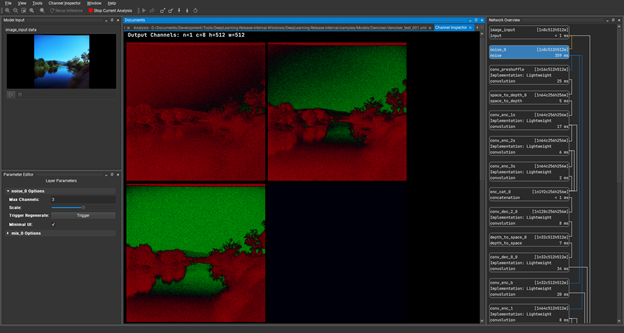
在 Channel Inspector 底下,按兩下 conv_enc_2s 層並載入該隱藏層的通道。這顯示了在推論過程中卷積神經網路的運算結果。
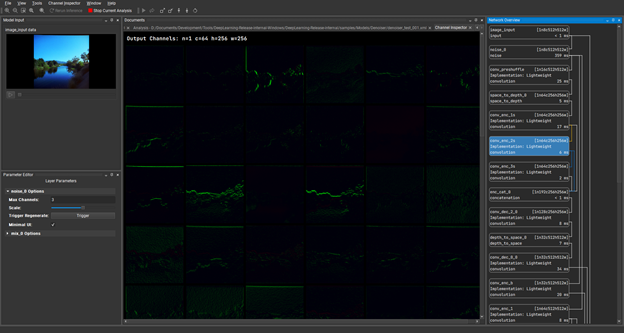
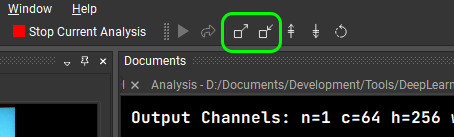
這些通道中的功能有點看不清楚,可使用放大圖示來放大畫面(圖12)。
這麼一來便能更好的瞭解這些層的效能,可清楚看到這裡沒有任何折疊。在模型中有很強的訊號傳播情況。顯示為綠色的數值都是正值,顯示為紅色的數值都是負值。
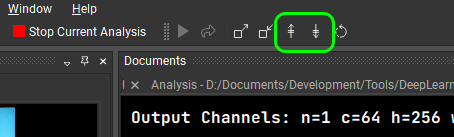
還能使用 Shift 鈕移動顯示的值,就可重新排列為顯示為正值或負值。
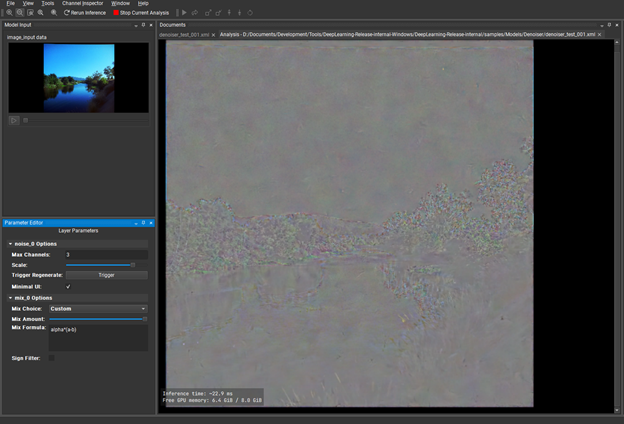
查看模型的最終輸出,將其與原始輸入進行比較。這就是 Mix 層派上用場的地方。關閉 Channel Inspector 並再次查看圖像輸出。使用左上角的縮放鈕,使輸出填充使用者介面,這樣就能真正看到正在發生的事情。
在左下角的 Mix Layer 底下,將 Mix Choice 改為 V Split。將 Mix Amount 滑桿從左拖到右,可看到在原始輸入和重新建構的除噪輸出內容之間出現了一個分割畫面(語意確認)。它當然有用,但效果還不明顯。
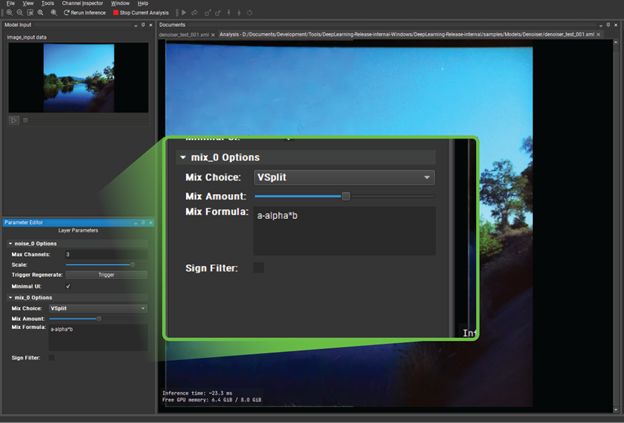
可得出這樣的結論:除噪器有發揮它的作用,但區別還是很不明顯。如何才能更清楚瞭解影像哪些部分的效能優於其他部分?
在 Mix Layer 底下,將 Mix Choice 改為 Custom。將 Mix Formula 現有的運算式替換為:alpha * (a-b)。alpha 關鍵字實際上是滑桿的正規化值,a 以及 b 是該層的兩個輸入。這將建立輸入和輸出的視覺差異,可使用 Mix 滑桿在視覺上增強這項差異,並且得知輸入和輸出之間的根本差異。
您可以從這類事情上得知,「對,您建立了一個不錯的模型」。 或是「您應該重新審視架構或訓練資料。」
結論
NVNsight 深度學習設計師工具提供了更多功能,例如高度最佳化的推論引擎 NvNeural,具有可擴展的外掛程式體系結構,讓您能實現自己的層類型。
深度學習設計師加上設計和分析工具,成為一個高度互動式和多功能的模型設計解決方案,可減少編碼錯誤和複雜性,進而把重心放在模型的功能和效能上。
若需更多資訊,請參閱以下資源:
- 下載最新版本的 Nsight 深度學習設計師工具。
- 閱讀 Nsight 深度學習設計師工具文件。
- 在 Nsight Systems 論壇發問或提出回饋。
- 註冊成為 NVIDIA 開發者計畫會員,免費取得 Nsight 開發者工具資源。
- 您也能在 NVIDIA CUDA 工具套件中中取得這些工具。