NVIDIA Triton 推論伺服器是一款開放原始碼人工智慧模型服務軟體,能簡化在實際作業環境中大規模部署經過訓練之人工智慧模型的作業。對伺服器管理的任何模型,用戶端可從遠端向提供的 HTTP 或 gRPC 端點發送推論請求。
NVIDIA Triton 可管理任何數量的模型和混合模型(受系統磁片和記憶體資源的限制)。它還支援多種深度學習框架,像是 TensorFlow、PyTorch、NVIDIA TensorRT 等。開發人員與資料科學家可彈性運用,不再需要使用特定的模型框架。NVIDIA Triton 設計為能與 Kubernetes 進行整合,以便在資料中心進行大規模部署。
多執行個體(Multi-Instance GPU,MIG)技術可最大化發揮 A100 GPU 及新發布之 A30 GPU 的 GPU 利用率。它還能平行運行多個工作負載,就像有多個更小的 GPU 一樣,讓多個用戶共用一個 GPU。MIG 功能可將單個 GPU 劃分為多個 GPU 分區,稱為 GPU 執行個體。每個執行個體都有專用的記憶體和運算資源,硬體層級的隔離可確保同時執行工作負載,又保證服務品質及故障隔離。
我們將在本文中分享以下最佳實務項目:
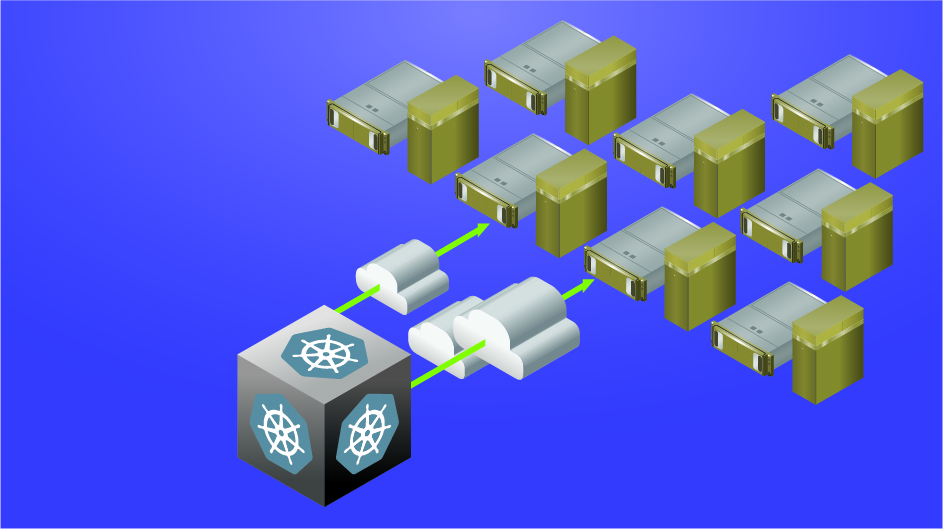
- 在 A100 上使用 MIG,平行部署多個 Triton 推論伺服器
- 使用 Kubernetes 和 Prometheus 監控堆疊,按照推論請求的數量自動調整縮放 Triton 推論伺服器的數量。
- 使用 NGINX Plus 負載平衡器,在不同的 Triton 推論伺服器之間均勻分配推論負載。
這個想法可用於單個節點或多個節點上的多個 A100 或 A30 GPU,以便在實際環境中自動調整縮放 NVIDIA Triton 部署。例如 DGX A100 允許在 Kubernetes Pod 上運行多達 56 個 Triton 推論伺服器(每個 A100 最多可有七個使用 MIG 的伺服器)。
硬體與軟體的先決條件
必須啟用 MIG 模式,且在 A100 或 A30 GPU 上建立 MIG 裝置以使用 MIG。可以使用 nvidia-smi 建立 GPU 執行個體,並手動運算執行個體。或是使用 NVIDIA 新的 MIG 分離工具 nvidia-mig-parted,讓管理員可定義一組可能的 MIG 配置,以用於節點上的所有 GPU 。
在運行時,將 nvidia-mig-parted 指向其中一個配置,nvidia-mig-parted 會負責應用它。相同的配置檔案可藉此分布在叢集中的所有節點上,且可使用運行時標誌決定將哪些配置用於節點。如果機器重新開機,MIG 配置會消失,nvidia-mig-parted 也簡化了重新開機後建立 MIG 執行個體的事情。
必須在 Kubernetes 環境中安裝 NVIDIA 裝置外掛程式及 GPU 功能發現外掛程式,才能使用 MIG。可單獨安裝每個外掛程式或是使用雲端原生的 NVIDIA GPU Operator,這個軟體包內有在 Kubernetes 中啟用 GPU 所需的所有內容。還能使用負責安裝和外掛程式的 NVIDIA 部署工具 DeepOps,以及內有包括 kube-prometheus、Prometheus 及 Prometheus Adapter 的 Prometheus 監控堆疊,可用它來自動調整縮放 Triton 推論伺服器。
可以在 Kubernetes 中使用 MIG 的單一策略或混合策略中的任意一個。我們在本文中建議使用混合策略,一個 A100 GPU 有七個 MIG 裝置,並且停用另一個 A100 MIG。
利用以 ResNet50 對花卉圖片進行分類的花卉演示內容。可以從 NGC 取得 NVIDIA Triton 推論伺服器容器映像檔。為花卉演示內容準備伺服器的模型檔案(*.plan, config.pbtxt)和用戶端。如需更多資訊,請見利用 NVIDIA 多執行個體 GPU 最小化深度學習推論延遲一文。
花卉演示內容與 Kubernetes
在設定好花卉演示內容後,您想把它擴大到 Kubernetes 環境中的部署。此舉可根據推論請求自動調整 Triton 推論伺服器的數量,並且在所有伺服器之間分配推論負載。一個 A100 上最多允許七個 MIG 裝置,最多可有七個 Kubernetes Pod,每個 Pod 都有一個 Triton 推論伺服器在 MIG 裝置上運行。以下是部署具有自動調整縮放及負載平衡功能之 Triton 推論伺服器的主要步驟:
- 為 Triton 推論伺服器建立一個 Kubernetes Deployment。
- 建立 Kubernetes Service,將 Triton 推論伺服器公開為網路服務。
- 使用 kube-prometheus 和 PodMonitor,向 Prometheus 公開 NVIDIA Triton 度量。
- 建立 ConfigMap 以定義自訂度量。
- 部署 Prometheus Adapter,將自訂度量公開為註冊的 Kubernetes APIService。
- 建立 HPA(Horizontal Pod Autoscaler)以使用自訂度量。
- 使用 NGINX Plus 負載平衡器在所有 Triton 推論伺服器之間分配推論請求。
以下各節將詳細說明為達到這些目標的步驟。
為 Triton 推論伺服器建立一個 Kubernetes Deployment
第一步是為 Triton 推論伺服器建立一個 Kubernetes Deployment。Deployment 為 Pods 和 ReplicaSets 提供了宣告式更新。Kubernetes 中的 ReplicaSet 同時啟動同一個 Pod 的多個執行個體。
以下的 flower-replicas3.yml 檔案創建了三個複製的 Pod,由 .spec.replicas 欄位指示,該欄位可以是 1 到 7 之間的任意數字。.spec.selector 欄位定義 Deployment 如何查找要管理的 Pod。每個 Pod 運行一個名為 flower 的容器,該容器運行版本為 20.12-py3 的 Triton 推論伺服器映像檔。與 NVIDIA Triton 連接埠號相同,容器連接埠 8000、8001、8002 分別保留給 HTTP、gRPC 和 NVIDIA Triton 度量使用。
.resources.limits 欄位使用混合策略,為每個 Pod 指定具有 5GB 記憶體的 MIG 裝置。nvidia.com/mig-1g.5gb 是混合策略的專用標記,必須根據 Kubernetes 叢集進行調整。在本例中,NVIDIA Triton 的模型使用 NFS 協定存在共用檔案系統上。若無共用檔案系統則必須確保將模型載入到所有工作節點,以便 Kubernetes 啟動的 Pod 可以存取。
apiVersion: apps/v1
 kind: Deployment
 metadata:
   name: flower
   labels:
     app: flower
 spec:
   replicas: 3
   selector:
     matchLabels:
       app: flower
   template:
     metadata:
       labels:
         app: flower
     spec:
       volumes:
       - name: models
         nfs:
           server:
           path: <path/to/flowerdemo/model/files>
           readOnly: false
       containers:
         - name: flower
           ports:
           - containerPort: 8000
             name: http-triton
           - containerPort: 8001
             name: grpc-triton
           - containerPort: 8002
             name: metrics-triton
           image: "nvcr.io/nvidia/tritonserver:20.12-py3"
           volumeMounts:
           - mountPath: /models
             name: models
           command: ["/bin/sh", "-c"]
           args: ["cd /models /opt/tritonserver/bin/tritonserver --model-repository=/models --allow-gpu-metrics=false --strict-model-config=false"]
           resources:
             limits:
               nvidia.com/mig-1g.5gb: 1
使用命令 kubectl apply 建立 Kubernetes Deployment:
 $ kubectl apply -f flower-replicas3.yml
 deployment.apps/flower created
確認有建立三個 Pod:
$ kubectl get pods
 NAME                               READY  STATUS  RESTARTS   AGE
 flower-5cf8b78894-2qqz8   1/1     Running            0          5s
 flower-5cf8b78894-g679c   1/1     Running            0          5s
 flower-5cf8b78894-xswwj   1/1     Running            0          5s
在這一步中部署了 ReplicaSet,可使用命令 kubectl scale,手動向上或向下調整 Pod 編號:
$ kubectl scale deployment flower --replicas=7
 deployment.apps/flower scaled
 $ kubectl get pods
 NAME                              READY   STATUS     RESTARTS   AGE
 flower-5cf8b78894-2qqz8   1/1     Running             0          69s
 flower-5cf8b78894-5znzt   1/1       Running            0          5s
 flower-5cf8b78894-g679c   1/1     Running            0          69s
 flower-5cf8b78894-gwgm6   1/1     Running            0          5s
 flower-5cf8b78894-shm2s   1/1     Running            0          5s
 flower-5cf8b78894-wrn9p   1/1     Running            0          5s
 flower-5cf8b78894-xswwj   1/1     Running            0          69s
為 Triton 推論伺服器建立一個 Kubernetes Service
第二步是建立一個 Kubernetes Service,將 Triton 推論伺服器公開為網路服務,以便用戶端可向伺服器發送推論請求。建立 Service 時,選擇自動建立外部負載平衡器,如 .type 欄位所示。此舉提供了一個外部可存取的 IP 位址,可將流量發送到節點上正確的連接埠。以下程式碼範例為 flower-service.yml 檔案:
apiVersion: v1
 kind: Service
 metadata:
   name: flower
   labels:
     app: flower
 spec:
   selector:
     app: flower
   ports:
     - protocol: TCP
       port: 8000
       name: http
       targetPort: 8000
     - protocol: TCP
       port: 8001
       name: grpc
       targetPort: 8001
     - protocol: TCP
       port: 8002
       name: metrics
       targetPort: 8002
   type: LoadBalancer
同樣的,使用以下命令建立 Kubernetes Service:
$ kubectl apply -f flower-service.yml
 service/flower created
確認已建立 Service:
$ kubectl get svc
 NAME    TYPE               CLUSTER-IP EXTERNAL-IP   PORT(S)       AGE
 flower   LoadBalancer   10.233.24.169        8000:31268/TCP,8001:32231/TCP,8002:30499/TCP                            69s
使用命令 kubectl expose 是另一個建立 Service 的方法。可通過 kubectl edit svc metrics 命令編輯 Service 檔案:
$ kubectl expose deployment flower --type=LoadBalancer --name=metrics
 service/metrics exposed
現在 Triton 推論伺服器已準備好接收來自遠端用戶端的推論請求(圖1)。如果用戶端發送推論請求,則用戶端可查看花卉圖片的分類結果,以及每個推論請求的處理量和端到端延遲情況。
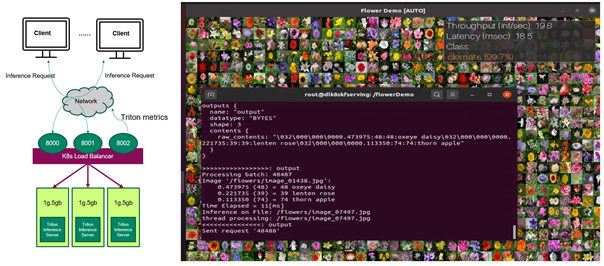
到目前為止,在 Kubernetes 環境中的 MIG 裝置上運行多個 Triton 推論伺服器,對用戶端發送的花朵圖片進行推論,可以手動更改伺服器數量。在下文中將對其進行改進,以便可按照客戶端請求自動調整縮放伺服器的數量。
使用 Prometheus 刨挖 NVIDIA Triton 指標
先收集可用於訂定自訂度量的 NVIDIA Triton 度量,以自動更改 Kubernetes Pod 上運行的 Triton 推論伺服器數量。多個 Kubernetes Pod 中有多組 NVIDIA Triton 度量,應部署一個 PodMonitor,告訴 Prometheus 從所有 Pod 中獲取度量。
Prometheus 是一個開放原始碼的系統監控和警報工具套件,提供按照度量名稱和鍵值/數值對來辨識的時間序列資料。使用靈活的查詢語言 PromQL 從 Prometheus 查詢度量。
為 Prometheus 建立 PodMonitor
PodMonitor 定義了一組 Pod 的監控,讓 Prometheus 用於發現目標。在 flower-pod-monitor.yml 檔案中可定義一個 PodMonitor 來監視伺服器的 Pod,如 .spec.selector 欄位所示。還需要 kube-prometheus,它包括 Prometheus 的部署,並且刨挖將 Prometheus 連結到各種度量端點的目標配置,如 .spec.podMetricsEndpoints 欄位所示。Prometheus 每 10 秒從這些端點刨挖由 .interval 欄位定義的 NVIDIA Triton 度量。
apiVersion: monitoring.coreos.com/v1
 kind: PodMonitor
 metadata:
   name: kube-prometheus-stack-tritonmetrics
   namespace: monitoring
   labels:
       release: kube-prometheus-stack
 spec:
    selector:
       matchLabels:
          app: flower
    namespaceSelector:
       matchNames:
          - default
    podMetricsEndpoints:
    - port: metrics-triton
       interval: 10s
       path: /metrics
不符合 Prometheus 自訂資源定義範圍的錯誤標記,造成一個跟 Prometheus 的 PodMonitor 辨識有關的常見問題。如要媒合 NVIDIA Triton Deployment 的標籤,請確保 .spec.selector.matchLabels 欄位為 app:flower,而 .spec.namespaceSelector.matchNames 欄位是 -default。兩者都應與 NVIDIA Triton Deployment 在同一個命名空間底下。檢查 flower-replicas3.yml 檔案中的相關標籤就能確認這件事。如要媒合 kube-prometheus 的標籤,還要確保 .metadata.labels 欄位為 release: kube-prometheus-stack。使用以下命令檢查標籤:
$ kubectl get Prometheus -n monitoring
    NAME                                                 VERSION   REPLICAS   AGE
    kube-prometheus-stack-prometheus   v2.21.0               1          56d
    $ kubectl describe Prometheus kube-prometheus-stack-prometheus -n monitoring
    Name:         kube-prometheus-stack-prometheus
    Namespace:    monitoring
    Labels:       app=kube-prometheus-stack-prometheus
               chart=kube-prometheus-stack-10.0.2
               heritage=Helm
               release=kube-prometheus-stack
    Annotations:
    API Version:  monitoring.coreos.com/v1
    Kind:         Prometheus
    Metadata:
    ……

       Pod Monitor Namespace Selector:
       Pod Monitor Selector:
          Match Labels:
             Release:   kube-prometheus-stack
使用命令 kubectl apply -f flower-pod-monitor.yml 部署 PodMonitor,並確認:
$ kubectl get PodMonitor -n monitoring
     NAME                                                  AGE
     kube-prometheus-stack-tritonmetrics   20s
使用 Prometheus 查詢 NVIDIA Triton 度量
Prometheus 預設帶有一個使用者介面,可在 Prometheus 伺服器的 9090 埠上存取該介面。在網頁瀏覽器中打開 Prometheus,並選擇 Status, Targets。此時可看到 kube-prometheus 正確偵測到了三具伺服器的指標,並將其加入 Prometheus 中進行刨挖。
可單獨查詢任何 NVIDIA Triton 度量,例如 nv_inference_queue_duration_us 或 nv_inference_request_success,或是使用 ProMQ 查詢以下自訂度量,並且獲得由 Prometheus 計算的三個值 (圖2)。加入 avg 以獲得三個 Pod 的平均值:
avg(delta(nv_inference_queue_duration_us[30s])/(1+delta(nv_inference_request_success[30s])))
選擇 Graph 時,Prometheus 還以圖形的形式提供時間序列資料。在下一節中將提供更多關於此度量的資訊。
![Prometheus can calculate the three values of the customer metric from three Pods.]](https://developer-blogs.nvidia.com/wp-content/uploads/2021/06/promql-query.png)
自動調整縮放 Triton 推論伺服器
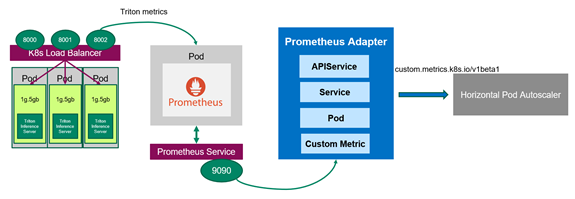
既然 Prometheus 在監視伺服器,那麼應該部署 Prometheus Adapter,它知道怎麼與 Kubernetes 及 Prometheus 傳遞資訊(圖3)。Adapter 有助於使用 Prometheus 收集到的指標來決定縮放。Adapter 定期從 Prometheus 收集可用的度量名稱,然後只公開遵循特定形式的度量。這些度量由 API 服務公開,可準備好供 HPA 使用。
選擇性進行:啟用授權綁定
在 Kubernetes 叢集中,基於角色的存取控制(role-based access control,RBAC)是常用來規定不同物件存取的方法。在本例中,必須允許在不同命名空間中運行的 HPA 存取 Metrics API 提供的度量內容。RBAC 的配置與 Kubernetes 叢集的配置有很大的相異之處。如需更多關於如何使用基於角色之存取控制的資訊,請見使用 RBAC 授權。
可在演示中發出以下命令,建立一個具有授權綁定的 ClusterRoleBinding 物件以允許 kubelet 使用者存取所有的 Pod。這將有效的停用 Kubernetes 叢集中任何類型的安全性,且不得用於生產環境。
$kubectl create clusterrolebinding permissive-binding --clusterrole=cluster-admin --user=admin --user=kubelet --group=system:serviceaccounts
建立 ConfigMap 以定義自訂度量
先告訴 Prometheus Adapter 如何收集特定指標。使用兩個 NVIDIA Triton 度量來定義 ConfigMap 中的自訂度量 avg_time_queue_us,其中 HPA 執行自動調整縮放。ConfigMap 有一個鍵值,這個值看起來像配置格式的片段。在 ConfigMap 檔案 custom-metrics-server-config.yml 中使用以下的值:
- nv_inference_request_success[30] 是過去 30 秒內成功的推論請求數。
- nv_inference_queue_duration_us 是以微秒為單位的累計推論排隊持續時間。
自訂度量是指過去 30 秒內每個推論請求的平均排隊時間,HPA 視該時間決定是否更改副本編號。
在配置 Prometheus Adapter 時,這些指標必須有一個已命名的端點,例如要定址的 Pod。日後無法從 Metrics API 查詢未定址的度量。加入 .overrides 欄位以強制要求稍後在 API 中公開 pod 及 namespace。
apiVersion: v1
 kind: ConfigMap
 metadata:
   name: adapter-config
   namespace: monitoring
 data:
   triton-adapter-config.yml: |
     rules:
     - seriesQuery: 'nv_inference_queue_duration_us{namespace="default",pod!=""}'
       resources:
         overrides:
           namespace:
             resource: "namespace"
           pod:
             resource: "pod"
       name:
         matches: "nv_inference_queue_duration_us"
         as: "avg_time_queue_us"
      metricsQuery: 'avg(delta(nv_inference_queue_duration_us{<>}[30s])/
 (1+delta(nv_inference_request_success{<>}[30s]))) by (<>)'

      Create the ConfigMap and confirm it:
 $ kubectl apply -f custom-metrics-server-config.yml
 configmap/adapter-config created
 $ kubectl get configmap -n monitoring
 NAME                                                      DATA   AGE
 adapter-config                                            1        22s
為 Kubernetes Metrics API 建立 Prometheus Adapter
若要使 HPA 對該自訂指標做出反應,必須為 Prometheus Adapter 建立 Kubernetes Deployment、Service 及 APIService。下面的程式碼範例是 Deployment 檔案 custom-metrics-server-deployment.yml。它使用上一步中的 ConfigMap,告訴 Adapter 收集自訂度量。它還建立了一個 Deployment,生成 Adapter Pod,從 Prometheus 那裡獲取自訂度量。.containers.config 欄位必須與 .mountPath 欄位,以及上一步 ConfigMap 中建立的檔案名稱 triton-adapter-configl.yml 相符。
apiVersion: apps/v1
 kind: Deployment
 metadata:
   name: triton-custom-metrics-apiserver
   namespace: monitoring
   labels:
     app: triton-custom-metris-apiserver
 spec:
   replicas: 1
   selector:
     matchLabels:
       app: triton-custom-metrics-apiserver
   template:
     metadata:
       labels:
         app: triton-custom-metrics-apiserver
     spec:
       containers:
       - name: custom-metrics-server
         image: quay.io/coreos/k8s-prometheus-adapter-amd64:v0.4.1
         args:
         - --cert-dir=/tmp
         - --prometheus-url=
         - --metrics-relist-interval=30s
         - --v=10
         - --config=/etc/config/triton-adapter-config.yml
         - --secure-port=6443
         ports:
         - name: main-port
           containerPort: 6443
         volumeMounts:
         - name: config-volume
           mountPath: /etc/config
           readOnly: false
       volumes:
       - name: config-volume
         configMap:
           name: adapter-config
為 Prometheus Adapter 建立 Kubernetes Service。在以下檔案 custom-metrics-server-service.yml 中,.spec.selector 欄位必須與 Deployment 中的標籤 app: triton-custom-metris-apiserver 相符,以指定提供服務的 Pod 。
apiVersion: v1
 kind: Service
 metadata:
   name: triton-custom-metrics-api
   namespace: monitoring
 spec:
   selector:
     app: triton-custom-metrics-apiserver
   ports:
   - port: 443
     targetPort: 6443
接著建立一個 APIService,以便 Kubernetes 可存取 Prometheus Adapter。然後可通過 HPA 獲取自訂度量。以下程式碼組塊是 APIService 檔案 custom-metrics-server-apiservice.yml。.spec.service 欄位必須與 Service 檔案的 .metadata 欄位相符。如要允許 autoscaler 存取自訂度量,應向 API aggregator 註冊度量。這裡需要使用的 API 是 custom.metrics.k8s.io/v1beta1。
apiVersion: apiregistration.k8s.io/v1beta1
 kind: APIService
 metadata:
   name: v1beta1.custom.metrics.k8s.io
 spec:
   insecureSkipTLSVerify: true
   group: custom.metrics.k8s.io
   groupPriorityMinimum: 100
   versionPriority: 5
   service:
     name: triton-custom-metrics-api
     namespace: monitoring
   version: v1beta1
在部署 Prometheus Adapter 前,可看到在 API 點沒有可用的指標:
 $ kubectl get --raw "/apis/custom.metrics.k8s.io/v1beta1" | jq
 Error from server (NotFound): the server could not find the requested resource
使用命令 kubectl apply 在前面提到的三個 .yml 檔案中套用配置。為 Prometheus Adapter 建立 APIService 後便能看到可用的自訂指標:
 $ kubectl get --raw /apis/custom.metrics.k8s.io/v1beta1 | jq .
 {
   "kind": "APIResourceList",
   "apiVersion": "v1",
   "groupVersion": "custom.metrics.k8s.io/v1beta1",
   "resources": [
     {
       "name": "namespaces/avg_time_queue_us",
       "singularName": "",
       "namespaced": false,
       "kind": "MetricValueList",
      "verbs": [
      "get"
      ]
      },
      {
       "name": "pods/avg_time_queue_us",
       "singularName": "",
       "namespaced": true,
       "kind": "MetricValueList",
      "verbs": [
      "get"
      ]
      }
   ]
 }
還能檢查這個自訂度量當前的數值,也就是 0,因為當前沒有來自用戶端的推論請求。在這裡選擇所有來自 default 命名空間的 Pod,花卉演示便是部署在該命名空間:
$ kubectl get --raw /apis/custom.metrics.k8s.io/v1beta1/namespaces/default/pods/*/avg_time_queue_us | jq .
 {
   "kind": "MetricValueList",
   "apiVersion": "custom.metrics.k8s.io/v1beta1",
   "metadata": {
     "selfLink": "/apis/custom.metrics.k8s.io/v1beta1/namespaces/default/pods/%2A/avg_time_queue_us"
   },
   "items": [
      {
       "describedObject": {
      "kind": "Pod",
      "namespace": "default",
      "name": "flower-5cf8b78894-jng2g",
         "apiVersion": "/v1"
      },
       "metricName": "avg_time_queue_us",
      "timestamp": "2021-03-25T15:49:10Z",
      "value": "0"
      }
   ]
 }
部署 HPA
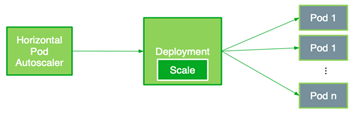
HPA 以觀察到的指標,自動調整縮放複製控制器、Deployment、ReplicaSet,或有狀態集中的 Pod 數量。現在可建立使用自訂度量的 HPA。HPA 根據以下公式控制部署在 Kubernetes 中的副本數量。它按照所需度量值和當前度量值之間的比率進行操作,並且返回所需的副本數量:

在本公式中使用以下數值:
是 Kubernetes 有的副本數。
是當前的副本數。
是當前度量:在這本例中是來自所有伺服器的自訂度量值平均值。
是所需的度量值。
以下 HPA 檔案 flower-hpa.yml 自動調整縮放 Triton 推論伺服器的 Deployment。它使用由 .sepc.metrics 欄位指示的 Pod 度量,該欄位獲取自動縮放目標控制之所有 Pod 中特定度量的平均值。考慮來自所有 Pod 之自訂度量的數值範圍,指定 .spec.metrics.targetAverageValue 欄位。該欄位觸發 HPA 定期調整副本數量,使觀察到的自訂度量與目標值相符。
apiVersion: autoscaling/v2beta1
 kind: HorizontalPodAutoscaler
 metadata:
     name: flower-hpa
 spec:
     scaleTargetRef:
       apiVersion: apps/v1beta1
       kind: Deployment
       name: flower
     minReplicas: 1
     maxReplicas: 7
     metrics:
     - type: Pods
       pods:
         metricName: avg_time_queue_ms
         targetAverageValue: 50
使用命令 kubectl apply -f flower-hpa.yml 建立 HPA,並確認:
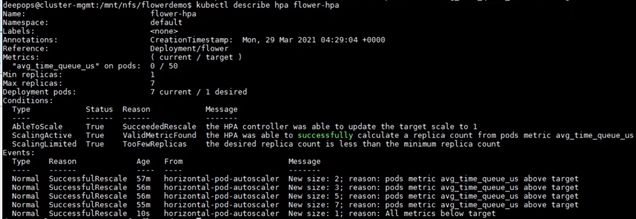
$ kubectl get hpa
 NAME         REFERENCE      TARGETS   MINPODS   MAXPODS   REPLICAS   AGE
 flower-hpa   Deployment/flower   0/50              1                 7                    1              22s
如果用戶端開始向伺服器發送推論請求,則新的 HPA 可獲取 Deployment 的自訂指標,並且建立所需的 Pod 數量。例如推論請求增加時,HPA 會將 Pod 的數量從 1 增加到 2,然後逐漸增加到 7;這是 A100 GPU 上最大的 Pod 數量。最後,用戶端停止發送推論請求時,HPA 將副本數減少到僅 1(圖5)。
使用 NGINX Plus 達到負載平衡
負載平衡將來自用戶端的負載,以最佳方式分布在可用的伺服器上。前面選擇了 Layer 4(傳輸層)的 Kubernetes 內建負載平衡器,使用 gRPC,在有限制的情況下可以輕鬆部署。
在本演示中使用 Prometheus,會發現 autoscaler 新加入的 Pod 無法使用 Kubernetes 內建的負載平衡器來獲得工作負載。若要改進這一點,請使用第 7 層(應用程式層)的 NGINX Plus 負載平衡器。工作負載均勻分布在所有 Pod 中,包括新擴展的 Pod。
由於 Docker Hub 無法提供 NGINX Plus 的商業產品,故該先建立 NGINX Plus 映像檔。使用取自 Docker Hub 的 NGINX 開放原始碼映像檔,在 Docker 容器中建立 NGINX 執行個體。然後,將本地映像檔推送到私有 Docker 註冊表。
接著使用以下命令,使用 role=nginxplus 標記要在它上面部署 NGINX Plus 的節點以部署 NGINX Plus(語意確認):
$ kubectl label node role=nginxplus
修改 Service,將 clusterIP 設定為 none,以便所有副本端點都由 NGINX Plus 公開和辨識。為避免混淆,請建立一個新的 Service 檔案 flower-service-nginx.yml,並且套用它:
apiVersion: v1
 kind: Service
 metadata:
   name: flower-nginx
   labels:
     app: flower
 Spec:
   clusterIP: None
   selector:
     app: flower
   ports:
     - protocol: TCP
       port: 8000
       name: http
       targetPort: 8000
     - protocol: TCP
       port: 8001
       name: grpc
       targetPort: 8001
接著建立 NGINX 的配置檔案。下面的程式碼範例假設使用位置 /path/to/nginx/config/nginx.conf。
resolver  valid=5s;
 upstream backend {
    zone upstream-backend 64k;
    server  resolve;
 }

 upstream backendgrpc {
    zone upstream-backend 64k;
    server  resolve;
 }

 server {
    listen 80;
    status_zone backend-servers;

    location / {
      proxy_pass http://backend;
      health_check uri=/v2/health/ready;
    }
 }

 server {
         listen 89 http2;

         location / {
             grpc_pass grpc://backendgrpc;
         }
 }

 server {
     listen 8080;
     root /usr/share/nginx/html;
     location = /dashboard.html { }
     location = / {
        return 302 /dashboard.html;
     }
     location /api {
       api write=on;
     }
 }
最後應該在下面的 nginxplus-rc.yml 檔案中,為 NGINX Plus 建立一個 ReplicationController。Kubernetes 需要有憑證,才能從私有註冊表中提取映像檔。配置檔案中的 imagePullSecrets 欄位指定 Kubernetes 應從名為 regcred 的 Secret 中獲取憑證。在這個配置檔案中,還必須將上一步建立的 NGINX 配置檔案裝載到位置 /etc/nginx/conf.d。
apiVersion: v1
 kind: ReplicationController
 metadata:
   name: nginxplus-rc
 spec:
   replicas: 1
   selector:
     app: nginxplus
   template:
     metadata:
       labels:
         app: nginxplus
     spec:
       nodeSelector:
         role: nginxplus
       imagePullSecrets:
       - name: regcred
       containers:
       - name: nginxplus
         command: [ "/bin/bash", "-c", "--" ]
         args: [ "nginx; while true; do sleep 30; done;" ]
         imagePullPolicy: IfNotPresent
         image: nvcr.io/nvidian/swdl/nginxplus:v1
         ports:
           - name: http
             containerPort: 80
             hostPort: 8085
           - name: grpc
             containerPort: 89
             hostPort: 8087
           - name: http-alt
             containerPort: 8080
             hostPort: 8086
           - name: flower-svc
             containerPort: 8000
             hostPort: 32309
         volumeMounts:
           - mountPath: "/etc/nginx/conf.d"
             name: etc-nginx-confd
       volumes:
         - nfs:
            server:
            path:
            readOnly: false
           name: etc-nginx-confd
使用以下命令建立 ReplicationController:
kubectl create -f nginxplus-rc.yml
驗證 Deployment。此時應該發現 NGINX Plus 正在運行:
 $kubectl get pods
 NAME                      READY   STATUS    RESTARTS   AGE
 flower-5cf8b78894-jng2g   1/1     Running   0          8h
 nginxplus-rc-nvj7b        1/1     Running   0          10s
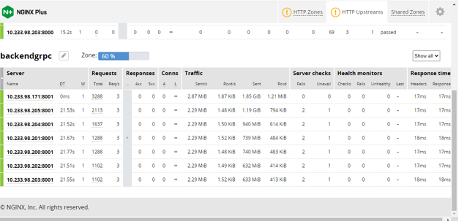
現在當用戶端向伺服器發送推論請求時,可看到 NGINX Plus 儀表板(圖6):
- autoscaler 將 Pod 的數量從 1 逐漸增加到 7。
- 工作負載在所有 Pod 中均勻分布,如 Traffic 所示。
此時還能檢查 Prometheus 中所有 Pod 的度量值或自訂度量值,確認新加入的 Pod 正在運作。
結論
本文介紹了在 Kubernetes 環境中使用 MIG 大規模部署 Triton 推論伺服器的步驟及程式碼。還介紹了如何使用兩種負載平衡器,自動調整縮放伺服器數量及平衡工作負載。我們有記錄所有步驟和結果,也可以觀看 GTC21 大會《使用多執行個體(MIG)與 Kubernetes 大規模部署 Triton》演講內容。
更多關於使用 MIG 在單個 A100 GPU 上平行運行多個深度學習工作負載的資訊,請見《使用 MIG 充分發揮 NVIDIA A100 GPU 的優點》一文。